A system in which several electrical components are connected to each other is called a network. "Network" can be used as a synonym for a circuit. "Network analysis" is a circuit analysis. It is only rarely said in this way. This adds a bit of mystery. In the field of radio frequency communication, any circuit unit having more than one port may be called a network, and such a network is often regarded as a "black box", and does not care about what is going on inside the circuit unit, but adds appropriate ports. The stimulus signal tests the circuit's response and thus characterizes this network's characteristics. The “network analysis†often referred to in the field of radio frequency communication is the work of portraying the performance of radio frequency circuits.
Scattering parameters
In order to further understand the convenience of network analysis, it is necessary to understand the language of network analysis—scattering parameters. Figure (1) is a Π-type attenuator, Figure (2) is its circuit diagram, how to describe its performance in the most simple and clear? It is not difficult for those familiar with traditional circuit analysis to think that the port on the right can be opened first, then the resistance on the left side can be tested with a multimeter; then the left side can be opened and the right resistor can be tested. Apply the appropriate current to the left side, then use the voltmeter to test the right voltage, and then test it again in reverse. Based on these data, four parameters are obtained in sequence: open-circuit input resistance, open-circuit output resistance, open-circuit forward transmission resistance, and open-circuit reverse transmission resistance. When you see this pile of dangling parameters, you must ask: What does this matter have to do with the attenuator, and what is the amount of attenuation that everyone likes to see?
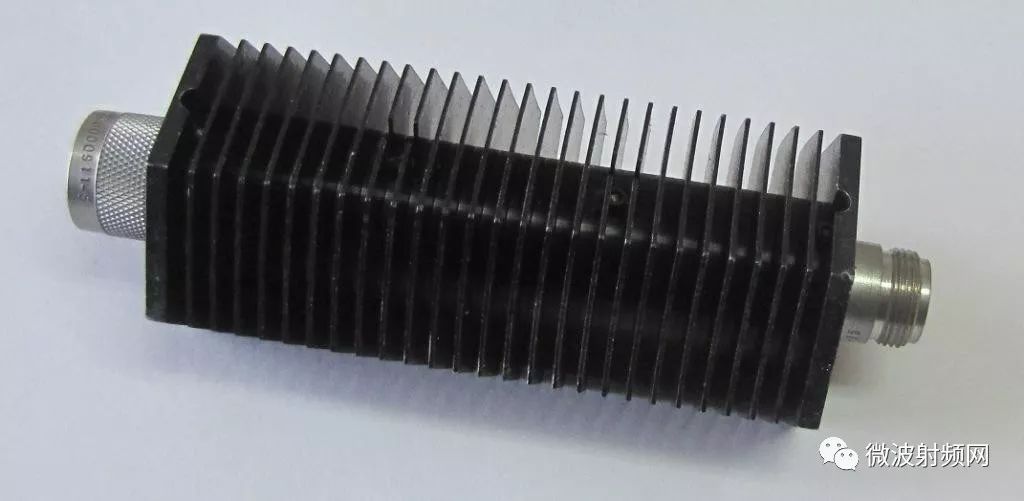
figure 1
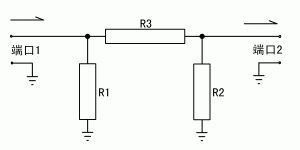
figure 2
This example shows that the commonly used Z-parameter (open-circuit impedance parameter) in low-frequency circuits is not suitable for use in the field of radio frequency communication and is difficult to measure. To sum up, there are three important reasons that prompted us to choose a new parameter to describe the circuit: (1) Most RF circuits do not allow the port to open or short circuit, because doing so will make the circuit deviate from the predetermined working state; (2) wavelength is very In a short time, even if the signal only travels a short distance, a non-negligible phase shift will occur, making the test calculation very difficult. (3) There is a need for a whole set of methods to quickly and easily design the circuit based on the parameters obtained. Based on the above reasons, scattering parameters emerged.
Scattering parameters are often referred to simply as S parameters. Similar to the impedance parameters, for a network with two ports (such as attenuators), it also includes four parts, denoted by Sij, where i denotes the port to be detected and j denotes the incident port of the excitation signal:
S11: The reflection amount of one port of the device under test (DUT) on the signal, also called the return loss;
S21: Change (amplitude and phase change, also called insertion loss or gain) when the signal passes through the device under test;
S12: Change in signal when the signal passes through the device under test in the opposite direction;
S22: The amount of reflection of the signal from the other port of the device under test.
When a port is not used during the test, a matching load should be connected so that the circuit can be very close to normal operation. Measuring the scattering parameters requires only understanding of the changes that occur when the signal flows through the device under test and does not affect the normal operation of the circuit. It is therefore simpler and more straightforward. The network analyzer to be described later is a device for measuring scattering parameters.
Through mathematical calculations, scattering parameters can be converted to other types of parameters.
S-parameters are normalized relative values
The four S parameters all represent the voltage ratio (or power ratio) of the outgoing signal to the incident signal, which should be uniform in the calculation. Still using the attenuator as an example, in figure (2), the power of the incident signal is 1W, through the device under test, the output is 0.1W, then S21 = 0.1/1 = 0.1. The converted component shell value is -10dB. So the attenuation of this attenuator is 10dB. This relative value is in turn a function of frequency. As the frequency changes, the attenuation of the attenuator may fluctuate. Taking the frequency as the abscissa and the attenuation as the ordinate, you can get the amplitude-frequency characteristic plot, abbreviated as the amplitude-frequency characteristic plot.
There are times when you need to be concerned with the change in phase after the signal passes through the circuit. For example, for an antenna, input a signal of 1W ∠0° to him, and measure the reflected signal power at the antenna port as 0.5 times of the incident signal (called the reflection coefficient), but the phase of the voltage between the reflected signal and the incident signal. With a difference of 90 degrees, the S11 of the antenna is expressed as 0.707 ∠90°, indicating a return loss of -3 dB and a phase lag of 90 degrees.
The benefits of network analysis
It is easy to understand the benefits of network analysis by understanding scattering parameters. The above example attenuator, after performing a network analysis on him, directly obtains the attenuation amount parameter, and can intuitively understand what effect the attenuator will have after accessing the radio frequency circuit. The following antenna examples further illustrate the convenience of this analysis method.
Through network analysis, the S11 parameters of the antenna can be directly measured, including an amplitude (or power) relationship and a phase relationship, such as 0.5∠90°. Figure (3) is a polar coordinate S11 diagram. Its radial coordinate represents the amplitude relationship, and the angle around the axis represents the phase relationship. Figure (4) is an impedance plot in rectangular coordinates. The abscissa represents the resistance and the ordinate represents the reactance. Perform coordinate transformation from Cartesian coordinates to polar coordinates for figure (4), and let the scale fit the relationship between unit impedance (Zn = Z/Z0, Z0 = 50 Ω) and the reflection coefficient (Γ). Equation Zn = (1 + Γ) )/(1-Γ), the impedance circle chart shown in (5) can be obtained. Figure (3) and Figure (5) overlap to get the Smith chart (Smith Chat, Figure 6). In this figure, the input impedance of the antenna can be read directly based on the S11 parameter. Our goal is to match to transmit the maximum power. There are two methods: (1) The end of the transmission line provides an output impedance that is conjugate to the input impedance of the antenna; (2) The input to the antenna is through debugging and access to matching components. The impedance becomes purely 50 Euro. For the latter method, the matching element size can be easily solved on a Smith chart.

image 3
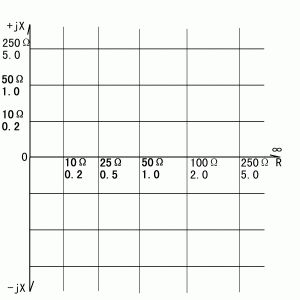
Figure 4
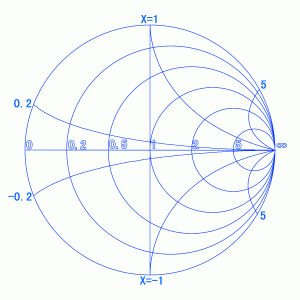
Figure 5
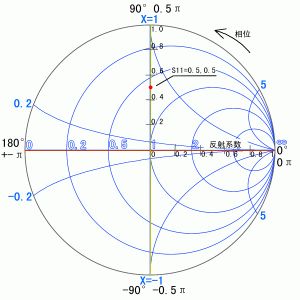
Figure 6
Whether it is a reflection coefficient-phase diagram or a Smith chart, there is no frequency coordinate. The S parameter of a frequency corresponds to only one point on the graph. The network analyzer displays the result by scanning a number of frequencies and then plotting the measured S-parameters on the graph and connecting them with smooth curves.
In fact, people invented a set of methods that use S-parameters, which can greatly simplify the design of RF circuits. There is already a lot of information in this area, and interested readers can understand for themselves.
Network Analyzer
With the above basics, we should now be concerned with how to obtain S-parameters. Although long ago, seeking S-parameters was already the most convenient method in network analysis, it was still a very troublesome thing. The principle is nothing less than using the signal source to send a stable signal to the device under test, and then use the level meter to measure the output power, or use the measurement line to test the voltage at different distances, so as to calculate the amplitude and phase. The problem is that this test can only be applied to one frequency at a time. If you want to understand the trend of changes at different frequencies, you need to make multiple measurements. Sometimes a test is a few days.
With the development of automation technology, computer-controlled network analyzers have been introduced. This type of instrument can continuously measure S-parameters at multiple frequencies and it only takes a few seconds. Especially in the recent ten years, network analyzers below 3GHz have significantly reduced their prices, and so-called “public version†instruments have appeared in the country. Local manufacturers have been surging in popularity, making it possible for such expensive equipment previously only large scientific research units to be installed. In the hands of almost all RF engineers, it will be popularized by enthusiasts in the near future.
The simplest network analyzer - Sweeper
Sweeper is a test device for S21 parameters. Its block diagram is shown in Fig. (7). It consists of a variable frequency signal source and a detector. The device under test is connected between the signal source and the detector. When testing, first connect the detector directly to the signal source, let the signal source sweep all the frequencies that need to be tested, and store the detected amplitude of the detector. After connecting the device under test, the detector detects a new amplitude (power) value. The S21 parameter can be obtained by comparing the new amplitude value with the just stored amplitude value. With computer-controlled continuous scanning of the signal source, amplitude-frequency characteristics can be plotted.
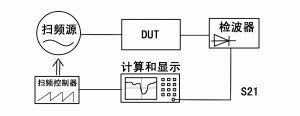
Figure 7
Adding a reflection bridge or directional coupler to the scanner can be used to measure S11 parameters. The S11 parameter and the voltage standing wave ratio (VSWR) can be directly converted, so the standing wave ratio curve can be displayed again.
The frequency sweeper can only obtain the amplitude-frequency characteristic diagram, so it is a scalar network analyzer.
Multi-input channel sweeper
The scanner of Figure 7 has only one detection channel. Although the S-parameter given by this instrument is a relative value, it is measured as an absolute value. From the absolute value to the S21 parameter, the test result is compared with the stored result. This approach cannot avoid the problem that the output power of the signal source may change with the device under test. To eliminate this error, a two-channel scanner (Figure 8) is usually used, with one channel acting as a "reference channel." With the splitter, a part of the signal is taken directly from the signal source and sent to the reference channel. The other channel value is compared with the reference channel to obtain the S parameter. The scalar network analyzers that are commonly seen are almost all such multi-channel scanners.
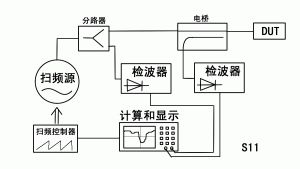
Figure 8
The multi-channel scalar network analyzer can also implement vector analysis with some clever methods, such as Karel Hoffman's technology. With the advancement of vector analyzers, this application has been decreasing.
Spectrum analyzer with tracking source
The detector of the scanner has broadband characteristics. Both the test signal, the harmonics of the signal source, and the various disturbances of the external coupling are detected at the same time. If the device under test is a trap, harmonics cannot be effectively compressed, so the amount of notch measured cannot be less than the amount of harmonics. If the device under test is an already installed antenna, the over-the-air signal received by the antenna will also enter the detector, which will cause the measured standing wave value to be large. In addition, the dynamic range of the detector is usually up to about 70dB, resulting in a smaller dynamic range of the instrument.
The spectrum analyzer with tracking source replaces the detector of the scanner with the receiver of the spectrum analyzer. The spectrum receiver only responds to the signal in the IF bandwidth. The harmonics of the tracking source and the externally coupled interference do not have a significant effect on the test result, so the notch type device can be tested. The spectrum analyzer has low detection noise and a good IF amplifier. This network analyzer, which consists of a tracking source and a spectrum analyzer, can typically achieve a dynamic range of over 100 dB.
If there is no tracking source, you can use the spectrum analyzer's maximum hold function, and manually scan the signal source to form a simple network analysis system.
Some high-end scalar network analyzers use similar schemes. Since the frequency of the network analyzer's signal source and its harmonics are predictable, the "spectrum receiver" of this instrument does not require too good an out-of-band rejection indicator. It can use much simpler reception than the usual spectrum analyzer. machine.
Phase detection
In addition to some special occasions, the previously mentioned network analyzer can only obtain the amplitude-frequency characteristic diagram and the standing-wave curve derived from it. Therefore, it is a scalar instrument. In order to obtain the impedance parameters of the device under test, the phases of the input and output signals must be compared. Therefore, a vector network analyzer (VNA) or abbreviation of the vector network is required. All network analyzers consist of a signal source and some form of detector dedicated to detecting the signal emitted by the signal source. The main difference between the vector network and the target network is the detector. In order to perform vector detection over a sufficient dynamic range, it is generally necessary to first mix the signal, use an intermediate frequency filter to accurately gate the signal generated by the signal source, and then perform a phase comparison at the intermediate frequency. The principle of this instrument is shown in figure (9).

Figure 9 Schematic diagram of a vector network analyzer
Historically, phase detection was mostly based on the principle of flip-flops. First, the two IF signals that need to compare phases are shaped and then sent to two flip-flops. When a trigger is triggered by a zero crossing on the rising edge of the signal, the counter starts a few clock pulses. When another trigger is triggered, the pulse count is stopped. This results in the time difference between the rising edges of the two intermediate frequencies. Since the frequency of the intermediate frequency is known, the phase difference can be obtained by simple conversion. Assuming that the IF frequency is 100 KHz, in order to obtain a 0.1 degree phase resolution, the clock frequency needs to be higher than 360 MHz without using additional means.
The currently used phase detection method is based on the principle of synchronous detection and is gradually implemented by digital signal processing technology. As with other methods, the output signal of the DUT and a portion of the input signal (known as the reference input, represented on the instrument using the R port) are first synchronously down-converted to the lower IF frequency. If no reference channel is provided, the signal source needs to be phase-locked with the variable frequency local oscillator. After IF filtering and amplitude conditioning, synchronous sampling is performed with the ADC. The resulting digital signal enters a large-scale FPGA and is digitally frequency-converted to generate two sets of I/Q signals. After digital filtering, one set of signals is conjugated and then conjugated. A set of signals are multiplied and the phase difference is calculated using an appropriate vector rotation algorithm. Other mathematical operations can also be used to obtain the phase difference. These processes are basically completed by software and have high flexibility. The digital processing process is carefully designed to achieve a phase detection accuracy of less than 0.1 degrees with a relatively high efficiency.
It is not enough just to get the phase difference and amplitude difference - these measured values ​​are not the actual conditions on the DUT. Whether it is mixing, filtering, signal conditioning, or cables, sockets, bridges, it will have an impact on amplitude and phase. These effects must be eliminated from the measured raw data to get the correct results. For the elimination of S11 measurement errors, an open-short-load three-step calibration is usually used. This calibration requires that the instrument port be opened first, storing a set of data in an open state, and then storing the data for a short circuit and matching the load. These data are used as known quantities of the error model to determine the error at any other test and to return the results back.
Using an appropriate calibration model not only eliminates the electrical length errors of the various connection lines inside and outside the instrument, the phase shift of the filters and amplifiers, but also significantly reduces the requirements for certain hardware specifications. It is just that these indicators have been difficult to improve. The orientation of the bridge is one example.
Here is an idealized example. The actual situation is much more complicated. It is known that the directionality of the standing wave bridge is 0 dB, that is, there is no directionality. How to measure a return loss of less than 30 dB, that is, an antenna with a standing wave of less than 1.1? Readers of the tachymeter may think it's a bit ridiculous, but calibration can really solve this problem if there is a buffer between the extraction point of the forward signal and the bridge. Imagine that if the instrument is connected to a matching load, the amplitude and phase relationships of the forward signal and the “reverse signal†measured at this time are stored. Then connect the antenna and let the instrument remeasure. According to the phase amplitude relationship just stored, calculate the “reverse signal†of the background and subtract it from the result to get the actual reverse signal. At this point you are probably thinking, if the isolation of the S21 test is not good, can it be processed?
Just now we did a subtraction, making directionality out of nothing and it looks fun, but it costs a lot. The instrument must have sufficient phase and amplitude resolution so that the software can calculate a small degree of directionality. The two sinusoidal signals, if not worse, are exactly equal to zero. If the difference is a little bit, there will be a lot of things left after the subtraction. For the vector web, a 0.1 dB amplitude resolution and a 0.1° phase resolution are the minimum indicators. It is difficult to maintain stability at such resolutions. Once drifted or the test conditions are changed, the calibration model is instantly invalidated, so calibration is often required.
Common uses of network analysis
From the above description, what network analysis can do, the reader may have thought far more than the author. Finally, we will sort out for everyone, as the end of the article.
The simplest network analyzer - frequency sweeper, with a small number of accessories (such as standing wave bridges), has been able to meet most of the verification purposes in communication engineering and the need for a small number of commissioning purposes. The result is S11 and S21. Scalar data. For example, test RF devices such as antennas, cables, and splitters. If the software supports it, it can also be used as a signal generator and field strength meter, although it is not very accurate. At the same time, the frequency sweeper can be used to debug the band-pass filter and find the resonant point of the coil and the resonant network. For the band-stop filter, notch filter, etc., if a large notch ratio is not required, preliminary debugging can also be performed. When debugging large notch wave traps (eg, duplexers), the viewing range can be increased by connecting low-pass or band-pass filters in series. Of course, the sweeper is a simple scalar instrument that cannot directly read the impedance and cannot intuitively find matching parameters. Based on the characteristics of wideband detection, it is also not advisable to use it to debug amplifiers and other active circuits.
The antenna analyzer is a single-port network analyzer. Although many things are called antenna analyzers, the properties are very different. If the bridge is built into the scanner, it becomes the simplest antenna analyzer that can test the standing wave curve of the antenna. Whether it is a frequency sweeper or such a simple talent, applications with strong external disturbances can make the test results inflated.
Between the scanner and the vector antenna analyzer, there is also a "half-vector talent" that has some form of ability to test phase or impedance but does not provide calibration. Use it to measure a 100Ω pure resistor antenna, if it is connected to the equivalent of one-eighth wavelength cable, it will be measured as 40-j30Ω. Manual corrections must be made when doing this test, otherwise it is confusing. Reasonably use this kind of talent, can debug the input impedance of the antenna, amplifier, can measure the resonance point of the aerial, coil. If the software supports it, it can also be used as a source.
Vector talent is a standard network analyzer that can measure complex S11 parameters and a series of data derived from it. With a perfect calibration function, the range of return loss that can be tested is usually better than 50 dB, and the measured impedance is also credible. Performing an inverse Fourier transform on the test data of one frequency band can yield several time domain parameters, such as the return loss of the cable at different distances. The vector talent has also been used to a certain extent in areas outside communication, such as testing the water content of crops.
Spectrometers with tracking sources and scalar networks with tracking receivers have similar uses as the scanners, but they all have much better dynamic range and better selectivity and can be used in antennas with strong interference conditions. Measurements and trap filters for large notch ratios, such as debug duplexers.
The full-featured dual-port or multi-port vector network includes all of the above applications and has powerful analysis capabilities. What needs to be mentioned is full-function vector network general standard group delay display and power scan function. The latter can analyze the nonlinear characteristics of the device.
The variety of network analyzers is far more than the above. Both have a signal source and several amplitude or phase amplitude detection channels. In combination with the necessary signal distribution devices, built-in or external directional bridges, couplers form a complete instrument. The purpose of the network is not fixed. After understanding its measurement principle, many ingenious usages can be derived. It is no exaggeration to compare it with the universal one in the field of radio frequency. Network analysis and network analyzers are the most basic for designing, debugging and improving RF circuits. They should also be the most commonly used tools and tools. After mastering network analysis technology, the design and production of RF communication circuits will be more interesting.
Htn Panel,Positive Transflective Lcd Display Module,Htn Monochrome Lcd Display,Htn 7 Segment Lcd Display
Huangshan Kaichi Technology Co.,Ltd , https://www.kaichitech.com